The context
The brief arrived wide open: research older adults within the family. We could have gone anywhere with that, to health, to autonomy, to housing. Our team of three chose the relationship between grandchildren and grandparents. It was my first research project of the degree, in the second semester of Interactive Design.
Two pieces of data justified narrowing it down. By 2035, Medellín will be the Colombian city with the largest population of older adults (Cardona, 2019). And between 2005 and 2018 households in Medellín went from 3.6 to 2.9 members on average (Medellín Cómo Vamos). Two curves crossing each other: there are more grandparents every year and less shared home with them. What is left in between is a bond that no longer holds up on living together alone.
The key design decision
The brief talked about a person. We decided to study a relationship, and a relationship has two ends: asking only the grandparent gave us half the bond, probably the more agreeable half.
That meant duplicating every instrument. The interview guide was written with each question marked by profile, some addressed to the grandchild and others to the grandparent, and several raised the same matter from both sides: we asked the grandparent how they create a positive space to be with their grandchild; we asked the grandchild whether they see their grandparent as someone who can support them emotionally. That is why two user personas came out of it and not one: Mariana, 14 years old, and María Elena, 61.
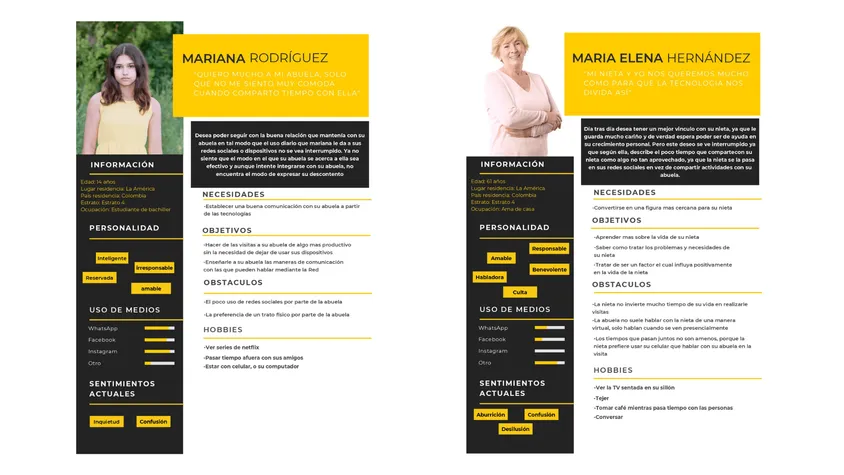
The crossover produced the most useful material of the whole project. Both describe the same friction and each blames the other’s habit: the grandmother says her granddaughter would rather be on her phone than talk during the visit; the granddaughter says her grandmother barely uses social media and prefers to meet in person. With only one of those two interviews, that clash never surfaces.
The process
We followed a sequence of six steps: literature review, problem definition, implementation of the methods, analysis of what we collected, synthesis and the framing of the design challenge. Before going into the field we set three objectives, and that is what kept the research from scattering: to understand the two main attitudes a grandparent takes when relating to their grandchild, to identify the five factors that affect that relationship in the long term, and to recognise whether the impact on the grandchild is positive or negative.
We used eight methods: stakeholder map, interviews, cultural probes, customer journey map, system map, user personas, empathy map and infographic. Two did the heavy lifting.
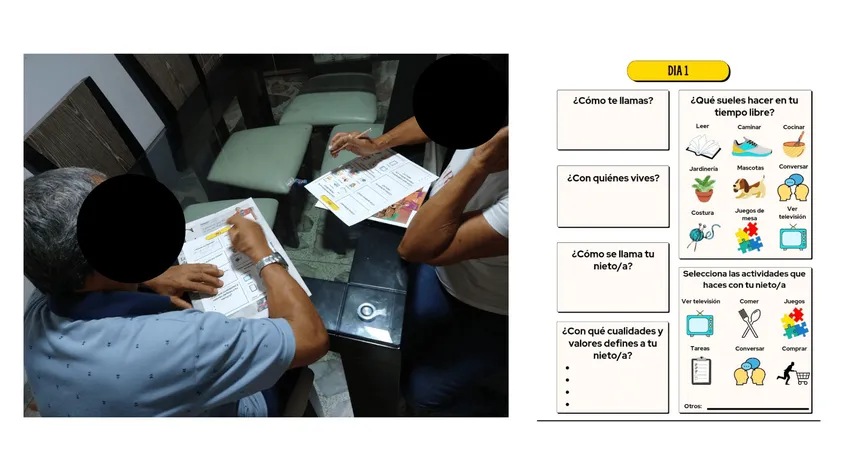
The cultural probes were a seven-day booklet we left in the grandparents’ homes for them to fill in on their own, with nobody watching: what do you usually do in your free time, what activities do you do with your grandchild, which of these people can you talk to comfortably, draw how you see your grandparent. Visual selection and drawing tasks rather than writing, because participation had to hold up for a full week. A one-hour interview collects what a person remembers; seven days in their home collect what they do.
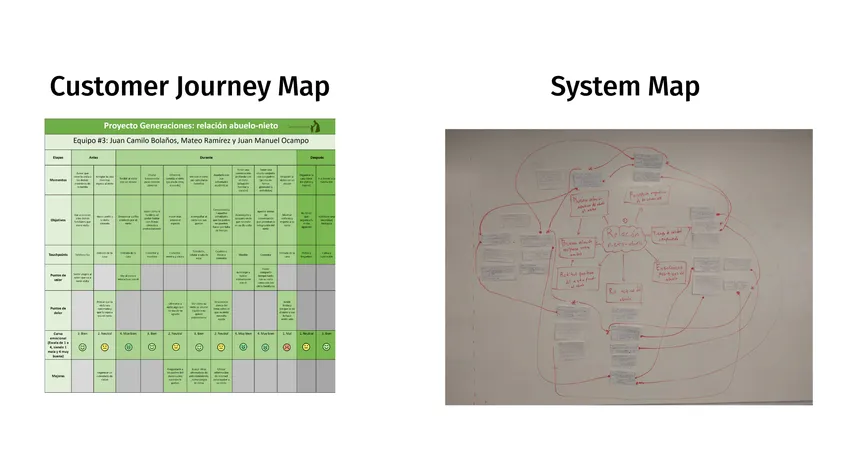
The customer journey map charted a complete visit, from the heads-up phone call to the goodbye, with its emotional curve. That is where the finding no interview had given us appeared: the lowest point of the visit is not a misunderstanding or an awkward silence, it is the end. The grandparent feels sad because the grandchild is leaving and that makes them feel alone, so the moment that closes the memory of the day is the worst one of all. We supplemented this tool with a system map to connect the older adult’s attitude with active support networks and quality time.
What we found
The synthesis closed on nine findings. The ones that weighed most:
- Communication is the main factor. Not how often they visit, not how they are related: what defines the relationship is how they talk to each other. And mutual knowledge makes it easier, so the thing feeds itself: the more they know each other the better they communicate, and the better they communicate the more they know each other.
- The grandparent’s attitude determines the quality of the shared time. That is where the two attitudes we were looking for came from, the inattentive grandparent and the committed one. The difference is not in how many hours they spend together, but in what the grandparent does with those hours.
- Grandparents take an active role, not a backup one. They see themselves as responsible for supporting and caring for their grandchildren, and they expect to be treated the way they treat them.
- Grandchildren weigh that relationship as heavily as the one with their parents. And 3 out of 4 grandchildren surveyed consider their grandparent’s teachings valuable for their future.
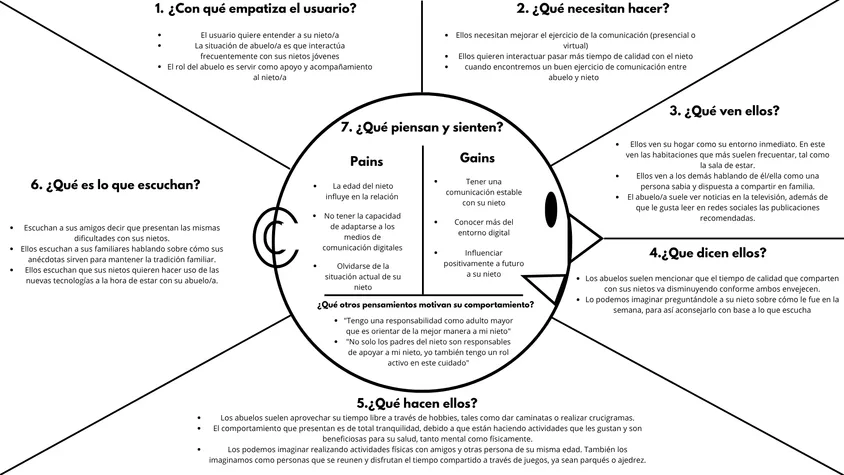
The wearing down showed up too: according to the grandparents, the older the grandchild the more independent they become and the less time they spend with them. The bond does not break, it thins out. We synthesised all these experiences and friction points in an empathy map focused on the older adult’s perspective.
“We spend a lot of time together. We really like watching television and talking” — A granddaughter’s testimony
The outcome
The final deliverable was an infographic gathering the nine findings, the testimonies from both sides and the figure about the teachings, and on top of it a question: how might we strengthen verbal communication between grandchildren and grandparents, taking digital media into account?
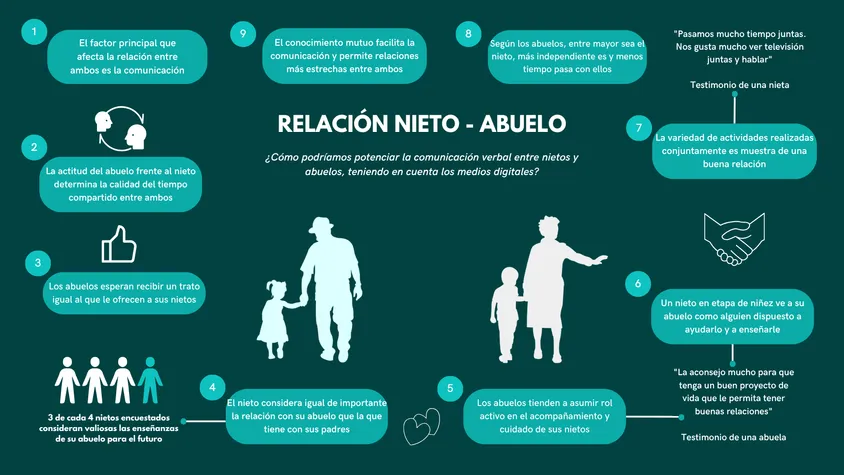
The project closes there, on the question, and that was the deliverable. We did not build an app or a service, because the scope was the discovery phase and its product is a well-grounded design challenge, which is what lets another team start designing without researching all over again. The question did not come out of a brainstorm: it came out of the first finding, and that is why it points at communication and not at how often they visit, which is what we would have gone after had we started from intuition.
One limitation worth stating: both user personas were built on a profile from a single neighbourhood and a single socioeconomic bracket of Medellín. The findings describe that context, not the whole city.
What I learned
Before going into the field we wrote five hypotheses. One of them said that grandparents interfere passively in their grandchildren’s lives because the parents’ role is more dominant. The data proved it wrong: grandparents take an active role, and grandchildren weigh that relationship as heavily as the one with their parents. Having written the hypothesis down beforehand is exactly what let me see I was wrong; had we kept it to ourselves, the mistake would have passed for a finding.
It was my first research project and it left me a habit I still use: state what I think is going to happen before measuring it. When the assumption is written down, the data that contradicts it is information. When it is not, you just find what you already thought.