The context
Industrial is a bar in Medellín whose owners wanted to digitize their operation: a menu customers could check from the table, a quick way to take orders and visibility over the business’s sales. The project came through a direct referral and was defined in meetings with the bar’s managers, who laid out their real operating needs.
The key design decision
The most interesting request of the project: customers must not be able to order from the QR code. In a bar, a customer a few drinks in can order by accident (or order too much), which leads to disputes when the bill arrives.
The solution was to design a single system with two faces:
- The customer scans their table’s QR code and browses the menu, the prices, the day’s promotions and the status of their bill. Nothing else.
- The server uses that same flow to enter the admin panel, select the table and register the order themselves, confirming it in person.
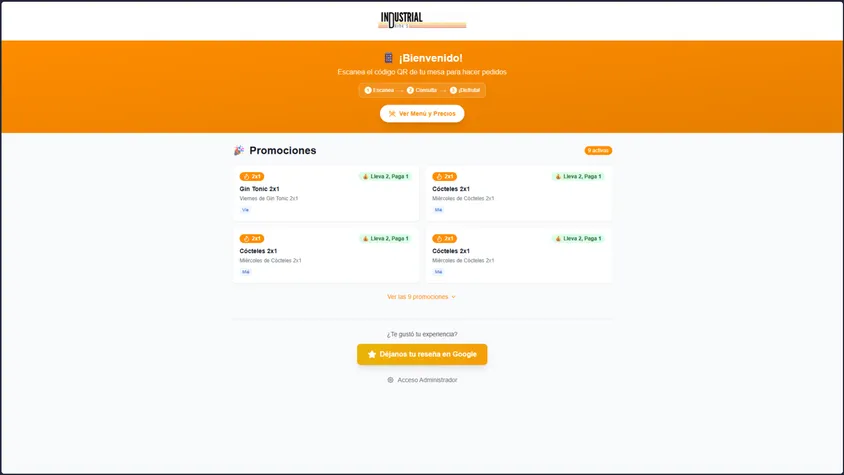
The order stays tied to the right table, the customer keeps control of what they consume, and the bar eliminates accidental orders. Designing for the real context of use, a bar at night and not an ideal app, defined the whole product.
The system
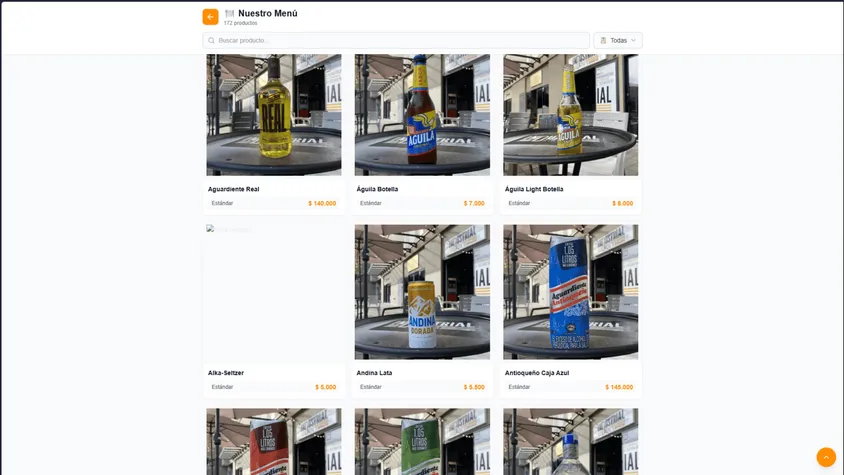
For the customer (via QR):
- Digital menu with over 170 products, categories and a search box
- Active promotions for the day (2-for-1, discounts, weekly raffles)
- Upcoming bar events (matches, special dates) on the home page
- Table bill lookup with the running total
- A direct link to leave a Google review
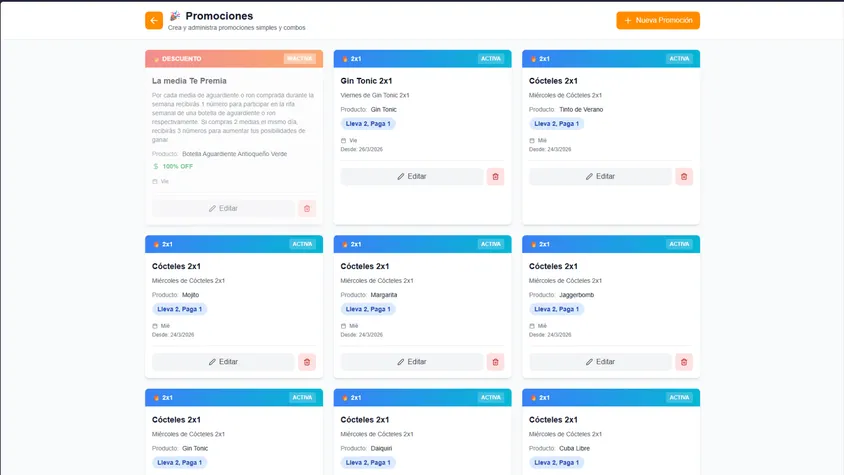
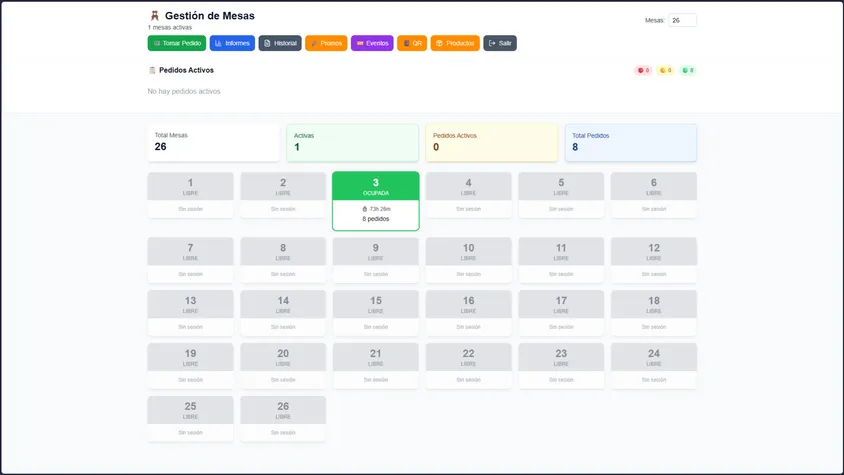
For the bar’s team:
- Visual management of 26 tables with real-time status
- Order taking by table from the admin panel
- Orders synced in real time, with a sound notification when a new one arrives
- Product management (create, edit, categorize, photos and variants)
- Creation and administration of promotions and events
- Reports: revenue, delivered orders, average ticket, sales by day and hour
- Full order audit trail (including voided ones) and export to Excel
The process
The first version followed the standard pattern of QR menus: the customer built a cart and sent the order from the table. Once that flow was confronted with the bar’s reality in the meetings with the managers, the model was flipped entirely: the customer browses, the server orders. The project’s best decision wasn’t in the initial plan: it came out of iterating with the people who live the operation.
The project moved in short cycles: progress shared over WhatsApp and in-person meetings at the bar, which produced concrete lists of adjustments: see the menu with prices from the QR, modify an order already sent, link events to WhatsApp for reservations.
The iteration continued after launch: the system evolves with real use. The managers report needs over WhatsApp, such as product photos that were getting cropped, the bill total on the QR, a history to check against invoicing or exporting data to Excel. Each of those adjustments reaches production the same day or the next. That short feedback loop is possible because the system was designed to be modified without friction.
The outcome
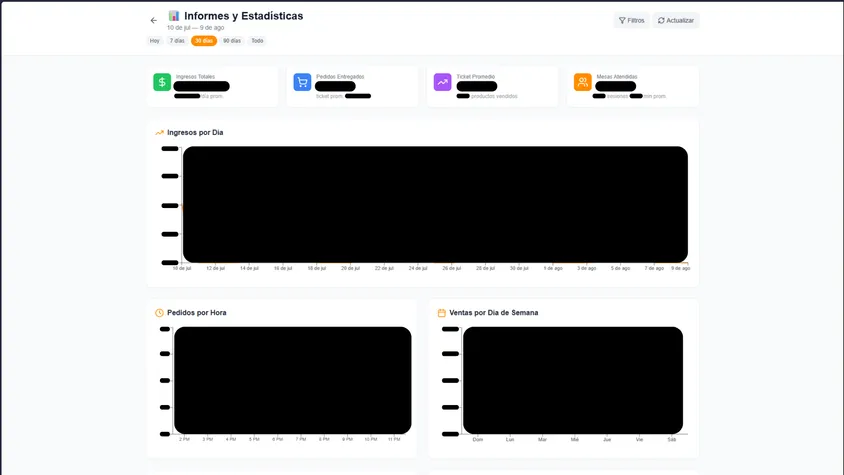
The system is in production and in daily use. The managers verified that the reports match the bar’s invoicing and inventory, which let them go from reviewing orders one by one to seeing the day’s summary in seconds.
The rest of the outcome shows in the nightly operation: the 26 tables and the 170-plus products are managed from a single panel, accidental orders are gone because the flow no longer allows them, and every adjustment the bar asks for reaches production the same day or the next. The system stopped being a deliverable and became part of how the business works.
What I learned
This project confirmed for me that user-centered design can drastically improve how a business operates, whatever its size. And it left me with a simple conviction: a system that is understood is a system that is enjoyed, both for the customer scanning the QR code and for the server using it all night.